Foreign Stocks Can Improve Investment Return and Lower Risk
Over the 27-year period from 1969 to 1996, foreign stock markets outperformed domestic (U.S.) markets about one-half of the time. Moreover, in the years that foreign markets outperformed the U.S., they had much higher gains compared to the years when the U.S. outperformed foreign markets. Only 23% if the world's 40,000 companies are in the United States. Looked at another way, foreign companies represent 51% of the world's $38 trillion total market capitalization. It is vital that this be represented in every well-diversified investment portfolio.
Some people argue that the impact of international diversification is dimished by an increasing correlation in performance between the U.S. and international markets. While it is true that world markets often react similarly to news or developments around the globe, over time international and domestic markets tend to behave quite differently.
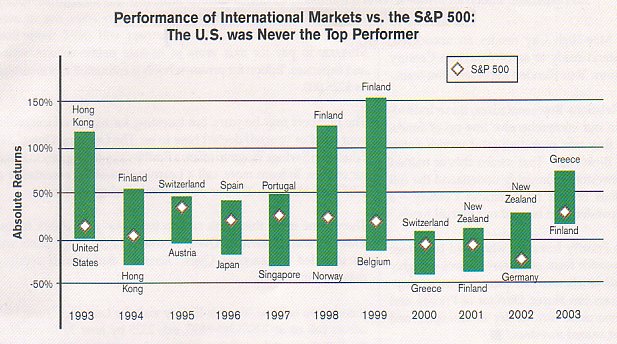
This chart shows that those nations that have led world markets (top of bar) in each of the past ten years, and those that have lagged (bottom of bar). The comparative performance of the U.S. stock market, represented by the S&P 500, is shown as a diamond in each bar. In no year was the U.S. ever the top or bottom performer. Note that in some years the performance of foreign indices, such as that of Finland in the late 1990s, has far outdistanced the S&P 500. (Source: Zephyr)
This curve shows that over time, a stock portfolio invested 100% in U.S. stocks will have a return of just under 13% and a standard deviation, which measures volatility or risk, of 16. In comparison, a portfolio of 100% foreign stocks would have a 15% average return, but at the cost of a much higher (22) standard deviation (risk). However, a mix of 50% U.S. stocks and 50% foreign stocks will have an expected return of 15%, halfway between a 100% U.S. and a 100% foreign portfolio. Moreover, at 14, the volatility or risk is much lower than either portfolio alone.
Most advisors today recommend a position on the curve of lowest volatility, which is a mix of about 65% U.S. stocks and 35% foreign. Such a mix would have an expected return over time of about 13.7% and a standard deviation of 12.8. Unfortunately, most people are not willing to put even this much of their stock investments in foreign holdings, and are unwittingly decreasing their expected return and increasing their risk.
Click here for a page of practical tips on managing your money.
Click here for a page of 16 basic principles of investing.
© 2004. Web site design by David Ahl, e-mail Z321go@aol.com.