Investment Returns of Different Asset Classes Vary Greatly Over Time
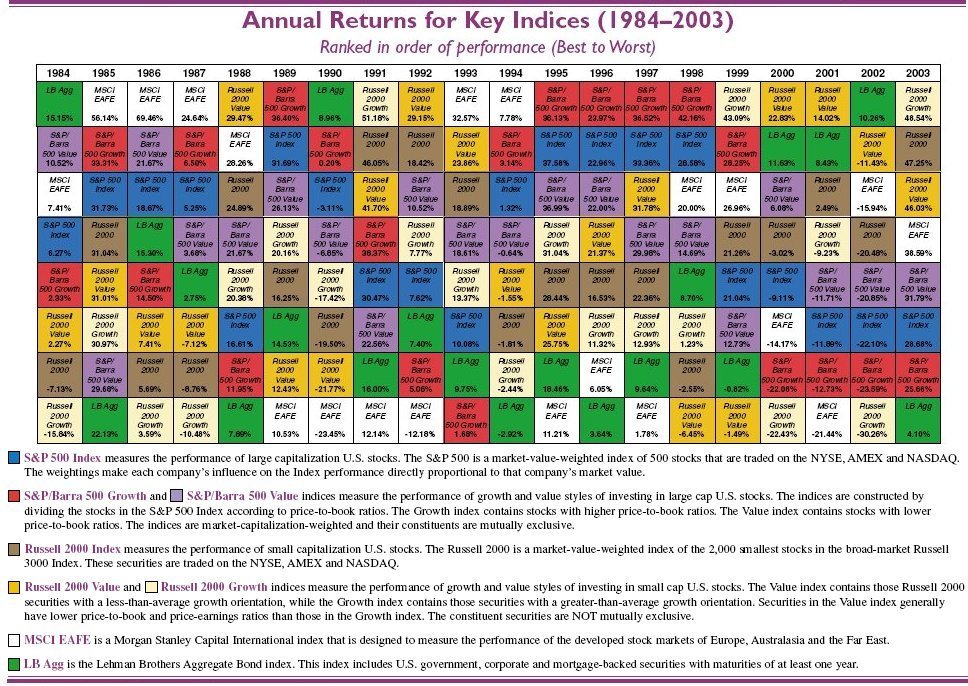
The Periodic Table of Investment Returns (above) produced by Callan Associates conveys an enormous amount of information. Above all, the table shows that the case for diversification, across investment styles (growth vs. value), capitalization (large vs. small) and equity markets (U.S. vs. international) is strong.
While past performance is no indication of the future, consider the following observations:
- The Table illustrates the unique experience of the 1995-1999 period, when large cap growth significantly outperformed
all other asset classes and the U.S. stock market in general enjoyed one of its strongest five-year runs.
- The subsequent three years (2000-2002) saw consecutive declines in large cap stocks for the first time since 1929-32.
The S&P 500 suffered its largest loss since 1974, declining 40% from the market peak in March 2000 through the end of
2002.
- 2003 was the best year for large cap stocks since 1997 and the best year for international stocks since 1986. It was
also the first time since 1997 that all of the asset categories depicted on the Table enjoyed positive returns.
- 2003 marked the fifth year in a row that small cap stocks outperformed large cap. Small cap growth topped the
performance rankings among all asset categories, rising from the ashes of a last place finish in 2002. It is interesting to
note that while the rankings among equity asset categories barely changed from 2002, the level of equity returns swung
from double-digit losses across the board to double-digit gains. Large cap growth ranked last among all equity categories
with a return of 25.66%.
- Value outperformed growth in both large and small cap equity markets following the bursting of the technology bubble
in March 2000.While value remained on top in large cap during 2003, growth won the race in small cap.The huge
disparity in performance between the two styles, seen during 1997-2000 for large cap and from 1996-2002 for small
cap, has disappeared.
- Fixed income ranked last in 2003 after ranking first in 2002 and second during the two previous years.The bond
market suffered one of its worst months in July and recorded its lowest annual return since 1999. Investors who clung
to the relative safety and quality of bonds following the three-year decline in the equity markets paid dearly for their
protection.
- The table highlights the uncertainty inherent in all capital markets. Rankings change every year.Also noteworthy is the
difference between absolute and relative performance. For example, witness the variability of returns for international
equity when it ranked last for four straight years 1989-1992.
This analysis assumes that market indices are reasonable representations of the asset classes and depict the returns an
investor could expect from exposure to these styles of investment. In fact, investment manager performance relative to the
different asset class indices has varied widely across the asset classes during the past 20 years.
(More information on Callan Associates is available on their web site at www.Callan.com.)
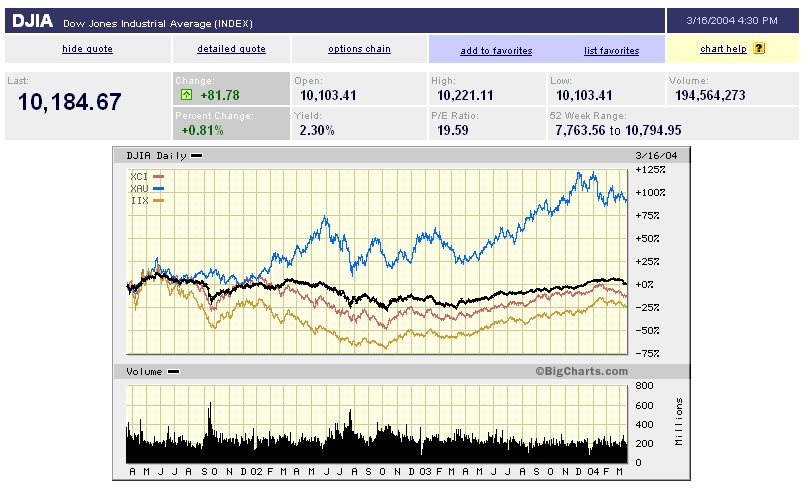 The chart above shows a three-year period from March 2002 to March 2004. The performance of indexes of four assets classes are shown.
- The top blue line shows that the perfomance of XAU, the index of precious metals (gold, solver, platinum) far outpaced other assets. Very impressive until you consider that precious metals showed practically no gain for the 20 years before this period.
- The black line in the middle shows the performance of the Dow-Jones industrial average (DJIA) of 30 stocks. This index was down more than 25% as of October 2002, but as of March 2004 had recovered to just about where it was three years earlier.
- The maroon line represents XCI, a broad-based index of technology stocks. This index was off by 50% (the value of the stocks in it had lost one-half their value) in October 2002, was back to its starting point early in 2004, but then started to drop again.
- The Internet Index (IIX) did the worst of all, losing nearly three-quarters of its value after 9/11 and still down 25% as of March 2004.
Like the Callan table, this chart further illustrates the need for and benefit of diversification, across asset classes, investment styles, market cap, and markets.
Click on the X in the upper right to close this window and return to the previous page.
Click here for a page of practical tips on managing your money.
Click here for a page of 16 basic principles of investing.
© 2004. Web site design by David Ahl, e-mail Z321go@aol.com.